
Searching:
0 results found Back
BackDashboards
Dashboards provide an at-a-glance view that shows a snapshot of the status of an Application. A Dashboard for an Application can contain one or more tabs, where each tab corresponds to a different Dashboard. Simply click a tab to view that Dashboard.
When working in a master Application, the Dashboard reflects all the Devices and Products under the Tenant, meaning those that belong to the master Application. The Dashboard tabs that display are those Dashboards created specifically for the master Application by a user of the master Application.
When working in a non-Master Application, the Dashboard shows the Devices, Products and Reports connected to that specific Application. Dashboards are Application-specific, and can only be viewed by users of that Application.
You can click the Settings ![]() button to display additional options for the Dashboard, as follows:
button to display additional options for the Dashboard, as follows:
- Edit Dashboard
 – Click to edit the Dashboard. Use this option to change the name of the Dashboard.
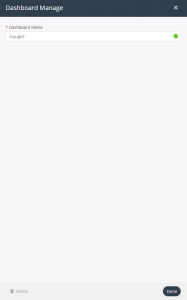
- Add Widget
 – Click to add a widget to the Dashboard.
  – Click to exit Edit Dashboard mode.
Default Dashboard
Each application automatically has a default, General Dashboard. This Dashboard cannot be modified.
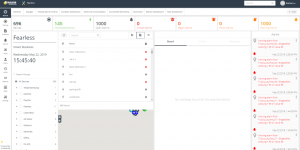
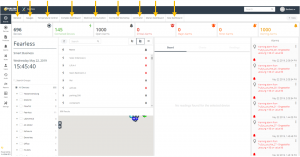
The default ready-made General Dashboard contains four main sections:
- Devices Pane– List of all connected Devices in a map or a combined view.
- Detailed Pane – Current readings, Charts tool and a last readings list for each Device.
- Application Overview– Device and AlarmInstance counters on top, last events list on the right.
Device Pane
- Group Hierarchy –Filter the Devices by the groups with which they are associated. Pressing a required group shows only its Devices in the Devices’ pane and their last readings in the detailed pane. In the tenant master Application, the Devices are grouped together under the Applications’ names in the hierarchy selector.
View Options – Display the Devices in a list, map or a combination of both. The default map focus is set according to the default country code set for the Application. The user can switch between Google’s satellite map and Google’s street view map. - Search Devices –Find a Device using the search.
Detailed Pane
Click any of the Devices to access its pane and select between three quick options:
- Current readings
- Charts tool
- Last readings list
Application Overview
The top panel contains counters that present the number of Devices, Connected Devices and active Alarms (by severity).
A chronological list of the last Alarms and Events appears on the right.